Telegraf & Prometheus Swiss Army Knife for Metrics
There are a lot of different solutions when it comes to collecting metrics, I found myself happy with this hybrid solution.
Telegraf is an agent written in Go for collecting metrics from the system it’s running on.
It’s developed by Influxdata the people behind InfluxDB, but Telegraf has a lot of outputs plugins and can be used without InfluxDB.
Many different platform (FreeBSD, Linux, x86, Arm …) are offered and only one single static binary (Thanks to Golang) is needed to deploy an agent.
Prometheus is a time series database for your metrics, with an efficient storage.
It’s easy to deploy, no external dependencies, it’s gaining traction in the community because it’s a complete solution, for example capable of discovering your targets inside a Kubernete cluster.
Here is a simple configuration to discover both products.
You can deploy the agent on every hosts you want to monitor but need only one Prometheus running.
Install Prometheus
Download Prometheus for your platform and edit a config file named prometheus.yml.
scrape_configs:
  - job_name: 'telegraf'
    scrape_interval: 10s
    static_configs:
      - targets: ['mynode:9126']
Prometheus is a special beast in the monitoring world, the agents are not connecting to the server, it’s the opposite the server is scrapping the agents.
In this config we are creating a job called telegraf to be scrapped every 10s connecting to mynode host on port 9126.
That’s all you need to run a Prometheus server, start it by specifying a path to store the metrics and the path of the config file:
prometheus -storage.local.path /opt/local/var/prometheus -config.file prometheus.yml
The server will listen on port 9090 for the HTTP console.
Install Telegraf
Download Telegraf agent for your platform and edit telegraf.conf.
[[outputs.prometheus_client]]
    listen = "127.0.0.1:9126"

# Read metrics about cpu usage
[[inputs.cpu]]
  ## Whether to report per-cpu stats or not
  percpu = true
  ## Whether to report total system cpu stats or not
  totalcpu = true
  ## If true, collect raw CPU time metrics.
  collect_cpu_time = false

# Read metrics about memory usage
[[inputs.mem]]

# Read metrics about network interface usage
[[inputs.net]]
  ## By default, telegraf gathers stats from any up interface (excluding loopback)
  ## Setting interfaces will tell it to gather these explicit interfaces,
  ## regardless of status.
  interfaces = ["en2"]
Remember this is the node agent “client” but since Prometheus server will connect it, you are providing a listening endpoint.
Starts the agent with telegraf -config telegraf.conf
There are many more inputs plugins for telegraf for example you can monitor all your Docker instance.
# Read metrics about docker containers
[[inputs.docker]]
  endpoint = "unix:///var/run/docker.sock"
  ## Only collect metrics for these containers, collect all if empty
  container_names = []
  ## Timeout for docker list, info, and stats commands
  timeout = "5s"

  ## Whether to report for each container per-device blkio (8:0, 8:1...) and
  ## network (eth0, eth1, ...) stats or not
  perdevice = false
  ## Whether to report for each container total blkio and network stats or not
  total = false
It’s also capable of monitoring third parties product like MySQL, Cassandra …
Read Metrics
Prometheus is provided with a visual HTTP console & query tool available on port 9090.
The query language is described here.
The console can’t be really used as a dashboard, you can use Grafana which can speak directly to prometheus.
Install or run Grafana with docker
docker run -i -p 3000:3000 -e "GF_SECURITY_ADMIN_PASSWORD=mypassword" grafana/grafana
Point your browser to the port 3000.
Add a Prometheus data source and point the host to your Prometheus server port 9090.
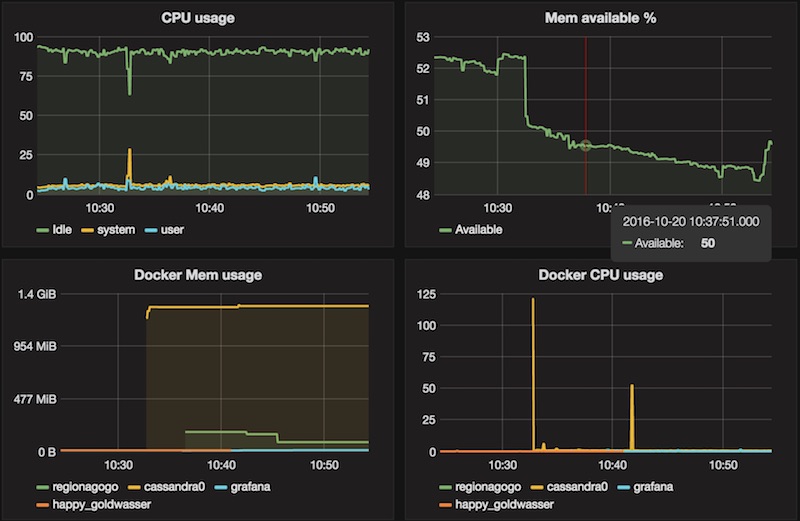
Then create your dashboard, here are some queries to display the telegraf agents:
-
CPU
cpu_usage_idle{host="myhost", cpu="cpu-total"}
cpu_usage_user{host="myhost", cpu="cpu-total"}
cpu_usage_system{host="myhost", cpu="cpu-total"} -
Memory
mem_available_percent{host="myhost"} -
Docker Memory
docker_container_mem_usage_percent
Legend format{{container_name}} -
Docker CPU
docker_container_cpu_usage_percent
Legend format{{container_name}}
Conclusion
You can easily instrument your own development using the client libraries.
There is also a Prometheus gateway for the short lived jobs, so you can batch to the gateway between the scrap period.
It’s a simple setup but capable of handling a lot of data in different contexts, system monitoring & instrumentation.